By Jen Saarbach & Kristen Kelly, Co-Founders of The Wall Street Skinny
Is the real risk in U.S. Treasuries…T Bills???
The financial press has been sounding the alarm for weeks. From Bloomberg to CNBC, heavyweights like Jamie Dimon and other trusted voices have been pointing to long-dated U.S. Treasuries as a risky investment.
Why?
Lack of fiscal discipline, inflation concerns, a recent ratings downgrade for the U.S., and a global selloff in the long end of other developed markets all point to concern for 20- and 30-year bonds.
And the institutional crowd is clearly listening. Recent positioning data shows that institutional investors have been piling into shorts, or at the very least, reducing their duration by moving further in on the yield curve.
Our former podcast guest Jamie Patton from TCW told Bloomberg: “We wouldn’t just look at the 30-year bond and say, ‘5%, let’s buy it’. We would look at it and say it’s actually still pretty rich vs. the rest of the curve.”
So, if you’ve been outright short 30s, has it worked out for you?
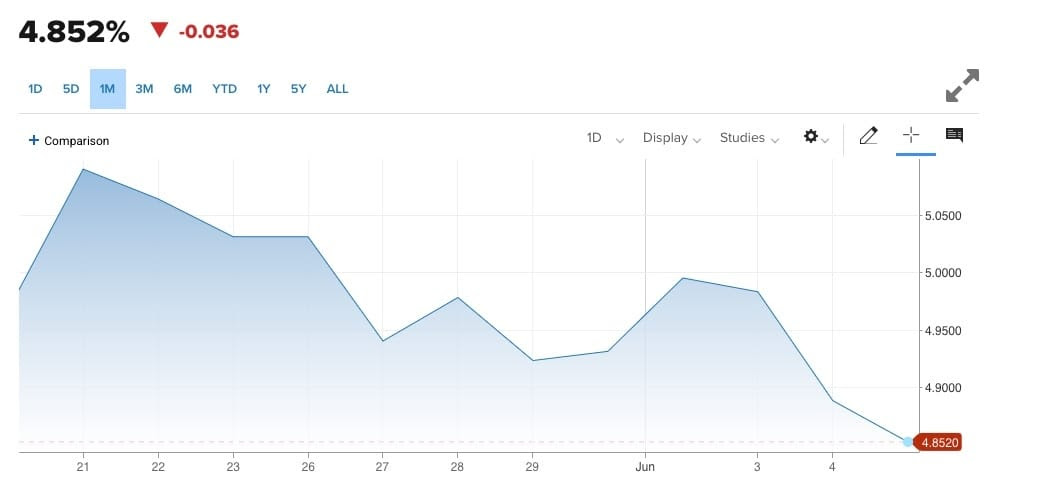 Source: CNBC
Nope. 30s have actually RALLIED more than 20 bps off their cheapest levels, which coincided with quarterly refunding, the launch of the “Big Beautiful Bill” and the Moody’s downgrade of the US.
Instead, the real impact has been a significant steepening of the Treasury yield curve: meaning, the difference between say 2-year Treasury yields and 30-year Treasury yields is growing.
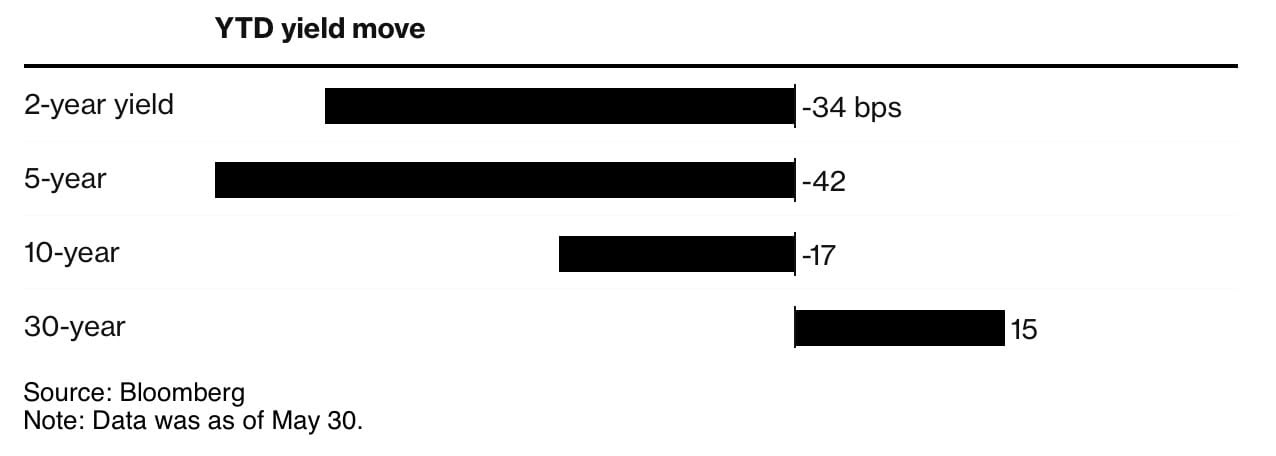
The YTD steepening of the yield curve (as of end of May). Source: Bloomberg
For example, if 2 year US Treasury yields are 4.00% and 30 year US Treasury yields are 5.00%, the slope of the 2s30s curve is:
5.00% – 4.00% = 1.00%, or 100bps.
If 30s sell off by 10 basis points and their yields go from 5.00% to 5.10%, while 2’s remain unchanged, the slope becomes:
5.10% – 4.00% = 110bps.
We’d say the curve has steepened 10bps in this case. We’d call it a “bear steepener”, because the increase in that differential is driven by 30s selling off, not by 2’s rallying.
However, the steepening move we’ve seen in reality has been what we call a “bull steepener”, meaning, 2 year yields are rallying more than 30 year yields are.
Watch the video HERE
https://www.instagram.com/reel/C4ap9sOAIaR/?utm_source=ig_web_copy_link
What does that mean for the market?
- It means that investors are still buying bonds. They’re just buying more SHORT-DATED bonds than long dated bonds.
- Those who are outright short the long end of the curve are getting squeezed right now.
- It puts investors at risk for something we call a “cash trap”.
Cash Trap
A cash trap happens when investors flock to short dated, safe haven instruments (like the T-Bills Warren Buffet so famously owns) at temporarily high rates. If the Fed cuts rates from current levels, that benefits your position…a little.
But because these are such short dated instruments, your price appreciation is minimal.
And then what do you do with all the principal you need to reinvest as those roll over and those formerly high yields are gone? Reinvest at extremely low yields? With minimal price appreciation potential, your returns start to look pretty bleak.
Whereas if you’d invested further out the curve, you would have benefitted from higher yields, higher duration, and most importantly higher price appreciation from a bullish move.
As always, when everyone in the markets is in agreement? Pay attention. Things can go very wrong.