

By Jen Saarbach & Kristen Kelly, Co-Founders of The Wall Street Skinny

What a viral article got right, what it got wrong, and what it hopes you don’t understand…
If your feed this past week served up doomsday headlines like “The Treasury just declared the U.S. insolvent. The media missed it”, you probably felt a momentary panic. That was the point.
The March 23rd Fortune magazine commentary, written by Johns Hopkins University’s Steve Hanke and David Walker, the former U.S. Comptroller General, was immediately amplified by news aggregators, gold sellers, BRICS cheerleaders, and the usual amalgamation of doom-and-gloom accounts that use social media algorithms to encourage panic.
Within 48 hours, the piece had been repackaged by dozens of outlets — from goldsilver.com to Azerbaijani state media — successively stripping away what little nuance the original contained and replacing it with the clickbait equivalent of a five-alarm fire.
To be clear: the U.S. Treasury did not declare the United States insolvent. Here’s what actually happened.
The Treasury published its annual Financial Report of the U.S. Government for fiscal year 2025, as it does every year.
The Government Accountability Office, JUST LIKE IT HAS DONE for 29 consecutive years, issued a disclaimer of opinion on the consolidated statements. What does that mean? It means that auditors could not conclusively determine whether the statements were fairly presented, primarily due to chronic accounting weaknesses at the Department of Defense.
THEN, the authors of the Fortune piece took those numbers and applied the word “insolvent.” That was their creative license. That was not an official verdict, nor would any bankruptcy court use those numbers as part of an insolvency test (more on that below).
So why am I all in a tizzy?
As someone with two decades of experience and understanding in the global bond markets, I was shocked to see the speed and enthusiasm with which this was pumped into the clickbait machine and promulgated across every corner of the internet. Our DMs were full of curious, well-meaning, legitimately concerned people asking questions about what this means. Other outlets were blindly resharing these headlines, perhaps secretly wondering what they meant. And others still were amplifying them with clear political or commercial motivations, like selling gold, promoting the cryptocurrency du jour, or advancing political narratives about American decline. This is what chatbot slop mixed with financial illiteracy looks like writ large.
Now, let’s give credit where it is due. The underlying fiscal data is true! But real data is being packaged for consumption in a way to cause maximum virality and concern.
We’re going to explain the various pieces so YOU understand what’s really going on.
First, let’s start with the Treasury report. The FY2025 consolidated financial statements show $6.06 trillion in total reported assets against 47.78trillionintotalliabilities,resultinginanetpositionof-41.72 trillion. Before we discuss those pieces, what’s also important is the direction of travel; according to the Treasury, that position had deteriorated $2.07 trillion from FY2024. The two main drivers when it comes to increased liabilities were federal debt and interest payable, which reached $30.33 trillion (up $2.0 trillion y-o-y), and federal employee and veteran benefits payable at $15.47 trillion (up $438.8 billion).
But what’s even crazier? That reported “on-balance-sheet” liability is a mere fraction of reality. To be fair, the Fortune piece does add value by mentioning this fact.
The U.S. Treasury discloses social insurance obligations separately in its Statement of Social Insurance. The 75-year unfunded obligation for Social Security and Medicare has in fact risen by $10.1tr over the past year, climbing from $78.3tr in FY2024 to $88.4tr in FY2025. The largest contributor was a $6.9tr increase in projected Medicare Part B shortfalls, followed by a $2.5tr increase for Social Security.
If you combine the on-balance-sheet liabilities (47.8tr)withtheseoff-balance-sheetobligations(88.4tr), total Federal obligations now exceed $136 trillion. That’s roughly five times annual GDP.
These off-balance-sheet figures showcase the real scope of the problem that headline budget deficit numbers never capture. But this has been the case for decades. Under Federal accounting standards (FASAB), social insurance obligations are not classified as balance sheet liabilities. They are disclosed separately. Why? Because Congress retains the legal authority to modify benefit levels, eligibility, and funding at any time. Said differently, the obligation to pay out your future Social Security benefits isn’t a contract like a bond. It’s more like a promise you hope someone will be able to keep.
And I cannot stress enough that none of this is new. The U.S. has run a budget deficit in all but four fiscal years since 1970. The GAO has been issuing disclaimers of opinion on these consolidated statements for 29 consecutive years. David Walker himself has been making this same argument using this same data set since his time as Comptroller General, which ended in 2008.
Moreover, there’s a thread of political motivation here that’s easy enough to track. Hanke and Walker are both affiliated with the Federal Fiscal Sustainability Foundation, an advocacy organization that promotes specific legislative solutions, including an Article V Constitutional Convention for a balanced budget amendment. Their Fortune op-ed concludes by promoting exactly those legislative initiatives. In fact, one might even suggest the article is actually policy advocacy masquerading as breaking news…but we’ll save those political developments for Part II of this article.
Now, just because it’s old news framed as an urgent crisis doesn’t mean we should ignore it. Here’s where it’s important to understand exactly how we’re accounting for the assets and liabilities of the Federal government. Then we can think critically about whether or not it’s appropriate — or misleading — to characterize the U.S.’s sovereign balance sheet as that of an insolvent corporation. I’m sure you can already guess what my conclusion will be, but let’s map it out.
There are two primary insolvency tests for companies (which the US is not, but we’ll start there): the balance sheet test and the cash flow test. Let’s start with the first.
Balance Sheet Test:
Accounting 101: “A” for assets (what you own), “L” for liabilities (what you owe), and “E” for equity.
A = L + E
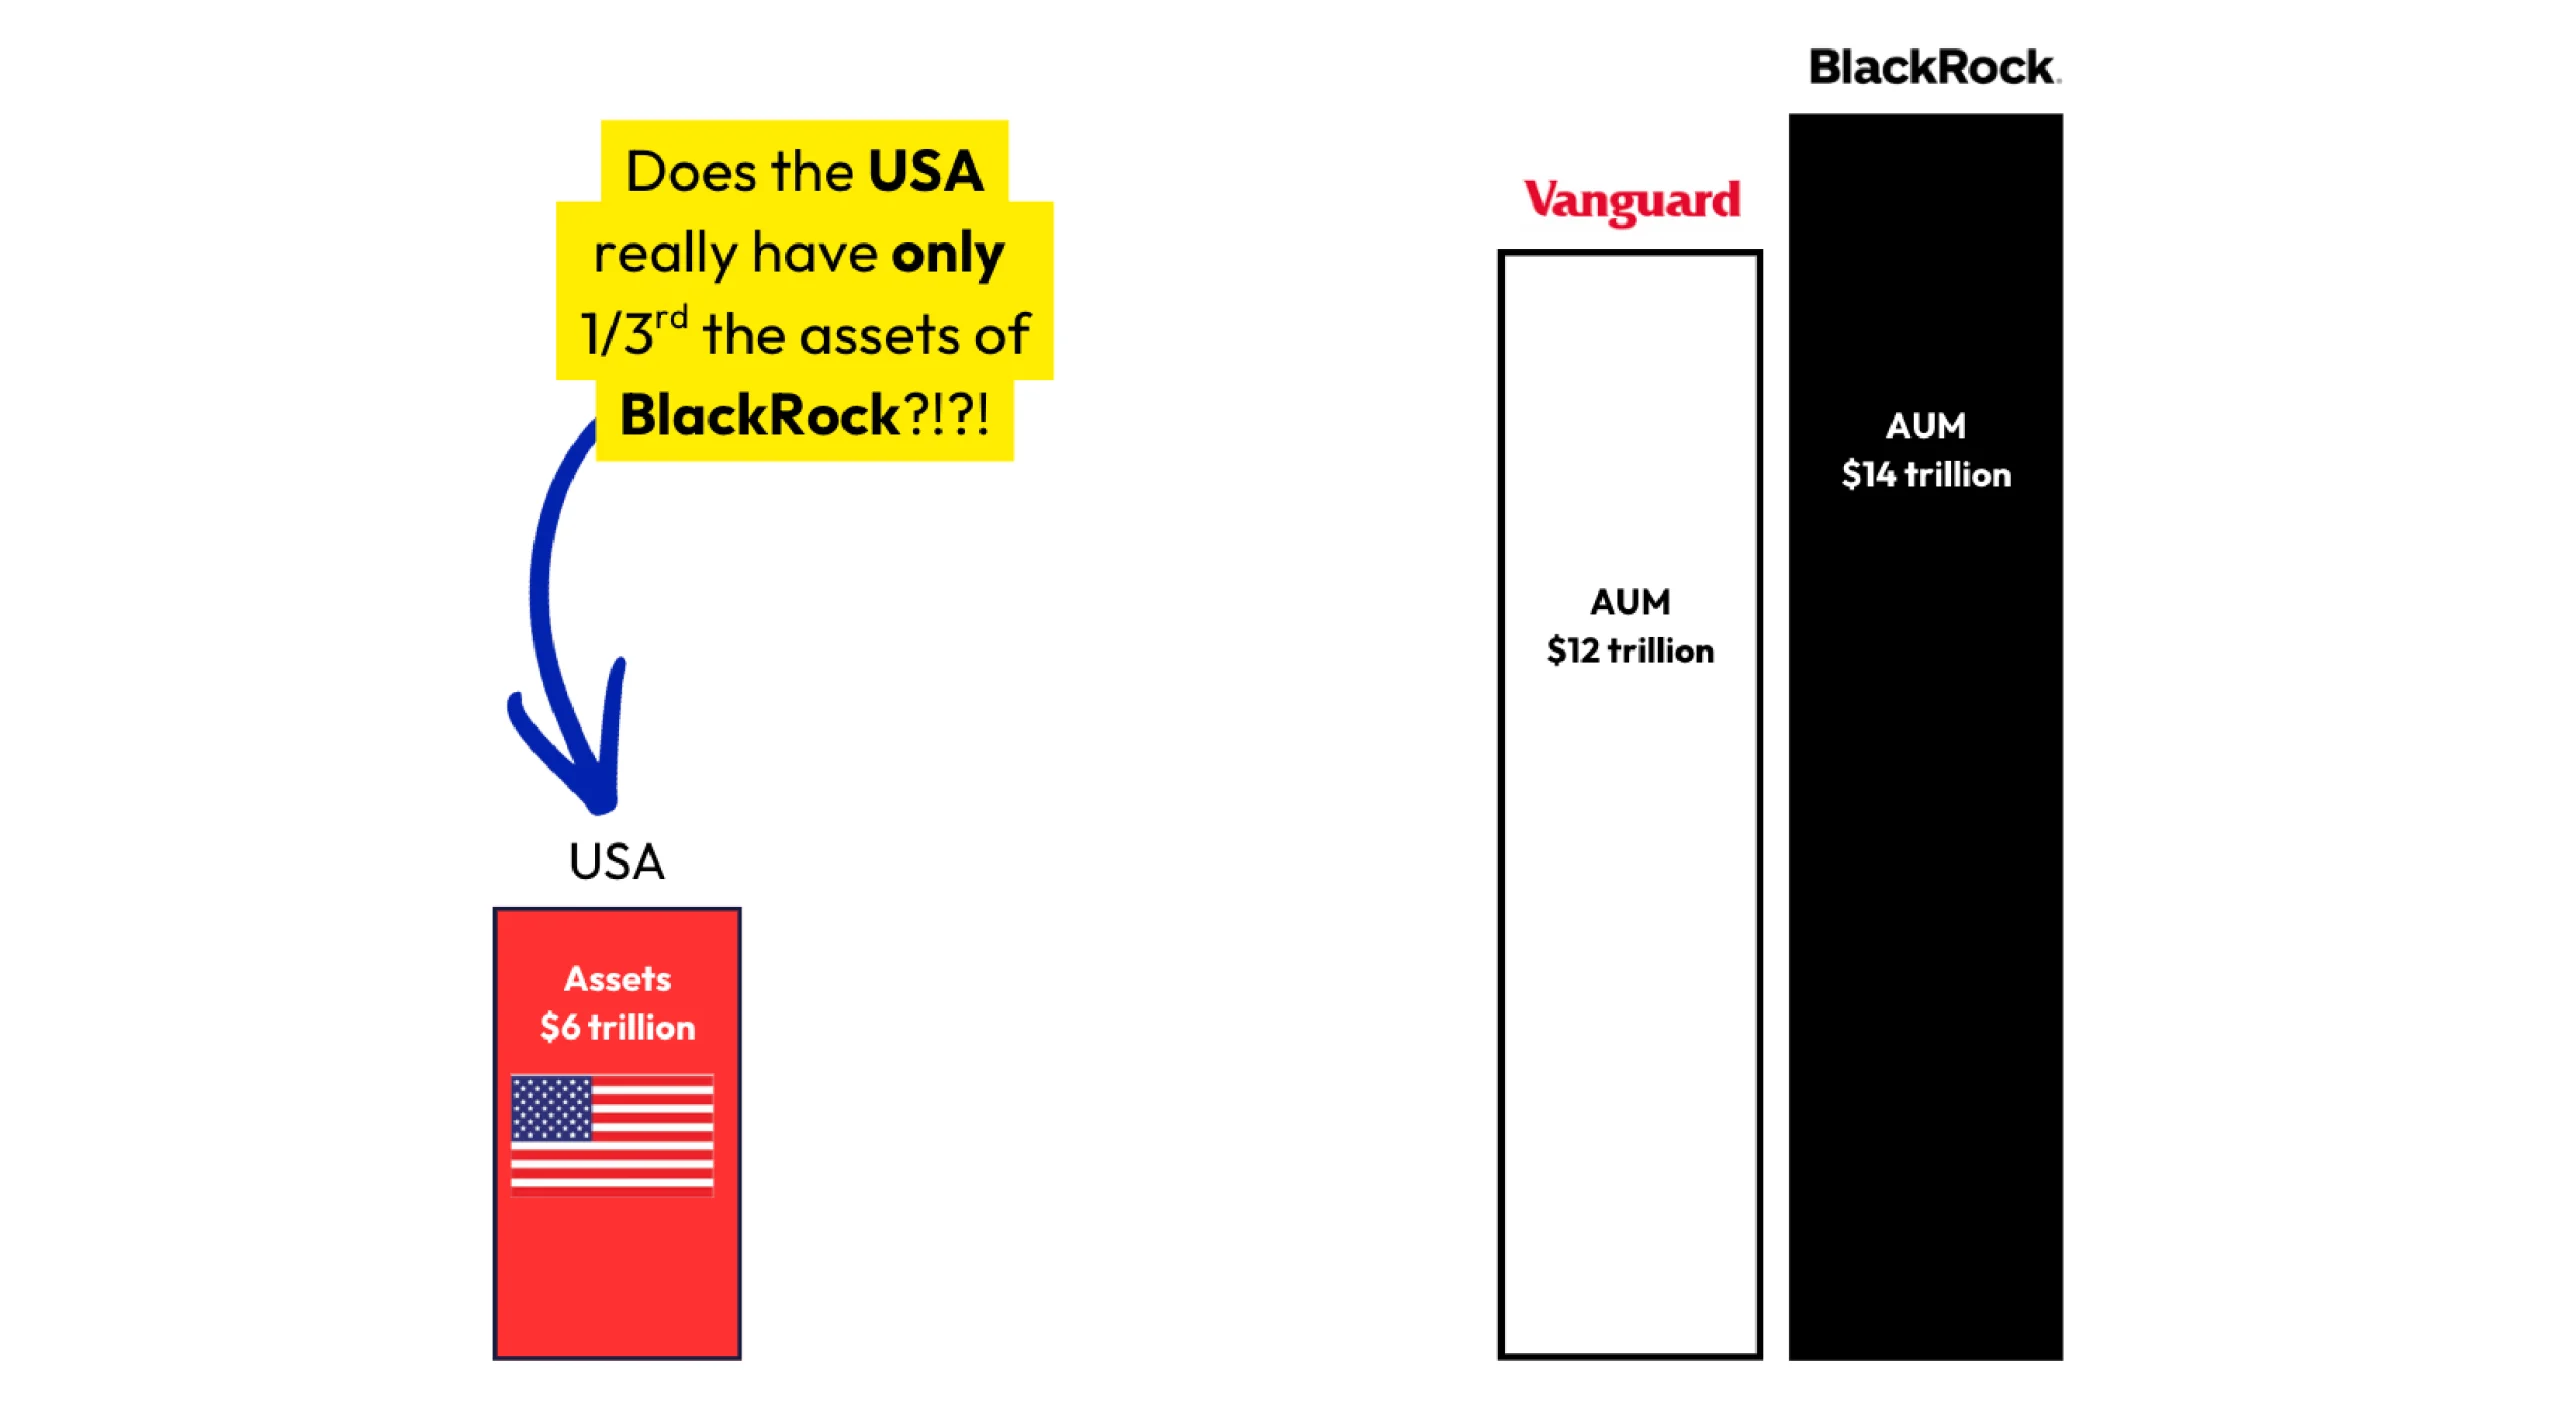
We talked about why the liabilities are understated, what what about those 6.06trillioninreportedassets.Something*doesn’tquiteaddup*iftheentiretyofUSgovernmentassetsamountstolessthanBlackRock’s(14 trillion), Vanguard’s (12trillion),orFidelity’s(7 trillion) as measured by their assets under management (“AUM”).
We’ll go line by line through what is on the books. But it’s important to note: the balance sheet used was put together under FASAB standards where many of the assets (PP&E, specifically) are listed at their HISTORICAL COST!!! This is like saying your grandparent’s house on the Malibu coast they bought for $250,000 in 1975 hasn’t changed in value since. There is a difference between historical cost and fair market value.
So keeping that in mind, let’s look at what’s included in that $6 trillion.
Cash and other monetary assets: ~$1.2tr. This includes the Treasury General Account balance, which you can think of as the Federal government’s checking account. It’s where cash comes in from tax revenues, and from which cash goes out for things like government employee salaries, welfare programs, and interest payments on the Treasury’s debt. Its fluctuations are also directly related to liquidity for the financial system (or lack thereof).
Loans receivable, net: ~$2tr. Primarily federal student loans and other direct lending programs….some of which may or may not be forgiven as policy shifts come and go.
Property, plant, and equipment (PP&E), net: ~$1.4tr. Remember what we said about “historical cost” vs. “market value”? This number represents the depreciated book value of government buildings, military installations, weapons systems, vehicles, and infrastructure. It includes the Pentagon, every military base, every federal courthouse, every national laboratory, and the entire stock of military hardware (aircraft carriers, fighter jets, tanks, satellite systems, etc). Under GAAP, these assets are carried at historical cost less accumulated depreciation. An F35 that cost $80mm is depreciated on a schedule and might show a book value of $30mm. A military base built in the 1950s might carry almost no book value at all. The replacement cost of the U.S. military’s physical assets alone dwarfs what appears on this line.
Inventory and related property: ~$504bn. Largely defense-related materiel, again at book value.
Investments in government-sponsored enterprises: ~$375bn. This is the Treasury’s equity positions in GSEs (i.e., Fannie Mae and Freddie Mac).
Other assets (accounts receivable, investments, advances, etc.): ~$586bn.
Rather than quibble with any individual line item here, I’ll just direct you to a single sentence. The Treasury’s own report explicitly states (and the Fortune article conveniently ignores) that: “the Balance Sheet does not include the financial value of the government’s sovereign powers to tax, regulate commerce, or set monetary policy, or value of nonoperational resources of the government, such as national and natural resources, for which the government is a steward.”
TL/DR: The government’s own accountants are telling you that this balance sheet is by design radically incomplete on the asset side. Here is what it omits:
The taxing power of the United States. No “insolvency” analysis that ignores the government’s primary revenue-generating capacity, which it can choose to change, can be taken seriously. Yes, we are absolutely running a massive deficit! But that hasn’t always been the case, and doesn’t always have to be.
Federal land and natural resources. The federal government owns approximately 640 million acres of land, which amounts to roughly 28% of the total U.S. land area. I couldn’t find a reputable study with recent figures, but the Bureau of Economic Analysis (BEA) estimated the value of the US government’s land holdings to be $1.8tr in 2009. For argument’s sake, let’s be conservative and assume that land has merely doubled in value to $3.6tr. More significantly, the Institute for Energy Research has estimated that the value of technically recoverable fossil fuel resources on federal lands and offshore areas — oil, natural gas, and coal — exceeds $150 trillion. Interior Secretary Doug Burgum has speculated that the total value of federal natural resources could approach $200 trillion. Even discounting those figures heavily for extraction costs and market uncertainty, the resource wealth beneath federal land vastly exceeds what appears on the balance sheet. The Bureau of Land Management reported that activities authorized on public lands generated $245.4bn in total economic output in FY2024 alone.
The gold reserves. The U.S. holds approximately 8,133 metric tons of gold — the largest sovereign gold reserve in the world. On the government’s books, this gold is carried at the statutory price set in 1973 (!) of $42.22 per troy ounce. At current market prices of $4,416 per ounce, the market value of U.S. gold reserves is something like $1.2tr. But of course, without a revaluation, it seems practically worthless by comparison.
Stewardship assets. The balance sheet references “Stewardship property, plant, and equipment” as a separate line item with no dollar value. This category includes heritage assets (national monuments, parks, museum collections, historic buildings) and assets whose value is considered immeasurable in financial terms. The Smithsonian’s collection alone contains over 155 million items. The National Park system covers 85mm acres. These carry zero book value.
So in terms of the “balance sheet test” for insolvency, you cannot in good faith use $6 trillion in assets. An insolvency test should use fair market value – the Bankruptcy Code itself requires assets “at a fair valuation”. These numbers are not that.
Cash Flow Test
In terms of the “Cash Flow Test”, you look at whether the entity can pay its debt as it comes due. This is arguably more important, as a company can have negative book equity yet still be solvent if it generates enough cash flow to meet obligations. In fact, as Kristen has covered before, when companies go through a leveraged buyout and the acquirer elects recap accounting, the resulting balance sheet can show deeply negative equity. It’s not because the business is insolvent, but rather because of how the purchase price gets allocated under the accounting rules. Regardless, by this test, the US is definitely solvent. It has never missed a payment and could generate more revenue at any time by raising taxes…not to mention it issues debt in a currency it controls.
Which brings us to the biggest fundamental error in the insolvency framing: treating the U.S. like a corporation in the first place. Sure, a corporation whose liabilities are 8x its assets is indeed insolvent. But the U.S. government isn’t Lehman Brothers, and it won’t be any time soon. Here’s why.
Again, the U.S. issues all its debt in its own currency, which it can also print. Every single U.S. Treasury bond, note, debt, bill, IOU, you name it outstanding is denominated in U.S. dollars. And the U.S. dollar just so happens to be the reserve currency of the world. That combination is what makes it different from all other sovereign governments, and certainly different from a corporation.
Many emerging market countries for decades (and some still to this day) could only issue debt in currencies outside their own. Take Argentina for example, or Ecuador, which is fully dollarized. Those are sovereigns that are truly at risk of insolvency. The UK, Switzerland, Japan, and many other highly rated sovereigns all issue overwhelmingly in their own currency just like the U.S does. They can also choose to print their own currency, which means they cannot be forced into default.
But the big distinction between those countries and the U.S is the fact that the U.S.’ native currency is something everyone else around the world has on hand. Something like 58% of global foreign exchange reserves are in U.S. Dollars.
And don’t even get me started on the monetary policy side of the equation. That’s right — many of those same liabilities on the TREASURY’S balance sheet are ASSETS on the Federal Reserve’s balance sheet!
As of March 18th, 2026, the Fed’s total balance sheet stood at approximately 6.7tr.TheoverwhelmingmajorityofthoseassetsareU.S.TreasurysecuritiesandagencyMBS.That’sdownfromapeakof~9tr when Quantitative Easing was in full swing. Even after more than two years of Quantitative Tightening, the Fed still holds a portfolio that is itself roughly equal in size to the government’s entire reported asset base.
By the way, this isn’t an accident. The Federal Reserve was designed (among other purposes) to serve as a buyer of last resort for U.S. government debt. The Fed can’t purchase directly from the Treasury (it conducts open market operations with primary dealers), but the effect is the same. When Quantitative Easing, the Fed can buy government debt and create bank reserves. No private corporation has a captive central bank that can do that with its debt. Absent a debt ceiling limit actually being imposed (for once), this is yet another reason why the term “insolvency” simply doesn’t apply.
Does this mean the U.S. can run deficits forever without consequence? Of course not.
Does it mean the Treasury market is ignoring fiscal risk? No.
The selloff in bonds we saw last April and again in the past few weeks reflects increased risk premium as a direct result of fiscal policy. Serious fixed income investors have been positioning around this very idea since time immemorial, and are examining this under a microscope as we speak to pinpoint the exact price of this risk. They’re not worried about an “insolvency” label, which suggests a default. Instead, here are the three things they’re most worried about:
1) Supply vs. demand. The amount of Treasuries outstanding is already enormous, and it’s growing quickly. But that’s only a big deal if no one shows up to buy them. The prospect of a buyers’ strike in the Treasury auctions last spring was what forced President Trump to backpedal on tariffs. We saw weak Treasury auctions this past week as well (full analysis to come!). So auction stats matter now more than ever.
2) Political dysfunction. “Stroke of the pen” risk is very real in today’s political environment, as is the recurring political theater we get every time we approach the debt ceiling. If new executive orders or fiscal reform legislation are passed, the dynamics we know and trust could change from one second to the next.
3) De-dollarization. The biggest difference between the selloff in bonds last April and the selloff this March has been the performance of the US Dollar. The former was concerning because it was accompanied by a collapse in USD. The latter, less so, given the dollar outperformed most of its global counterparts. A weakening dollar combined with rising Treasury yields is a much scarier scenario for bond investors.
At the end of the day, I welcome anything that gives us an excuse to shed light on the bond markets. And I wholly agree with the premise that our current fiscal trajectory demands serious attention from everyone, ranging from sophisticated Fixed Income investors to everyday citizens. However, while the U.S. government’s balance sheet can be compared to a corporation’s, it simply cannot be measured the same way.